Now live: a hybrid process digital twin for amine gas sweetening — it names the fault and the root cause, not just the alarm. Request a demo →

QEM & OPS logo
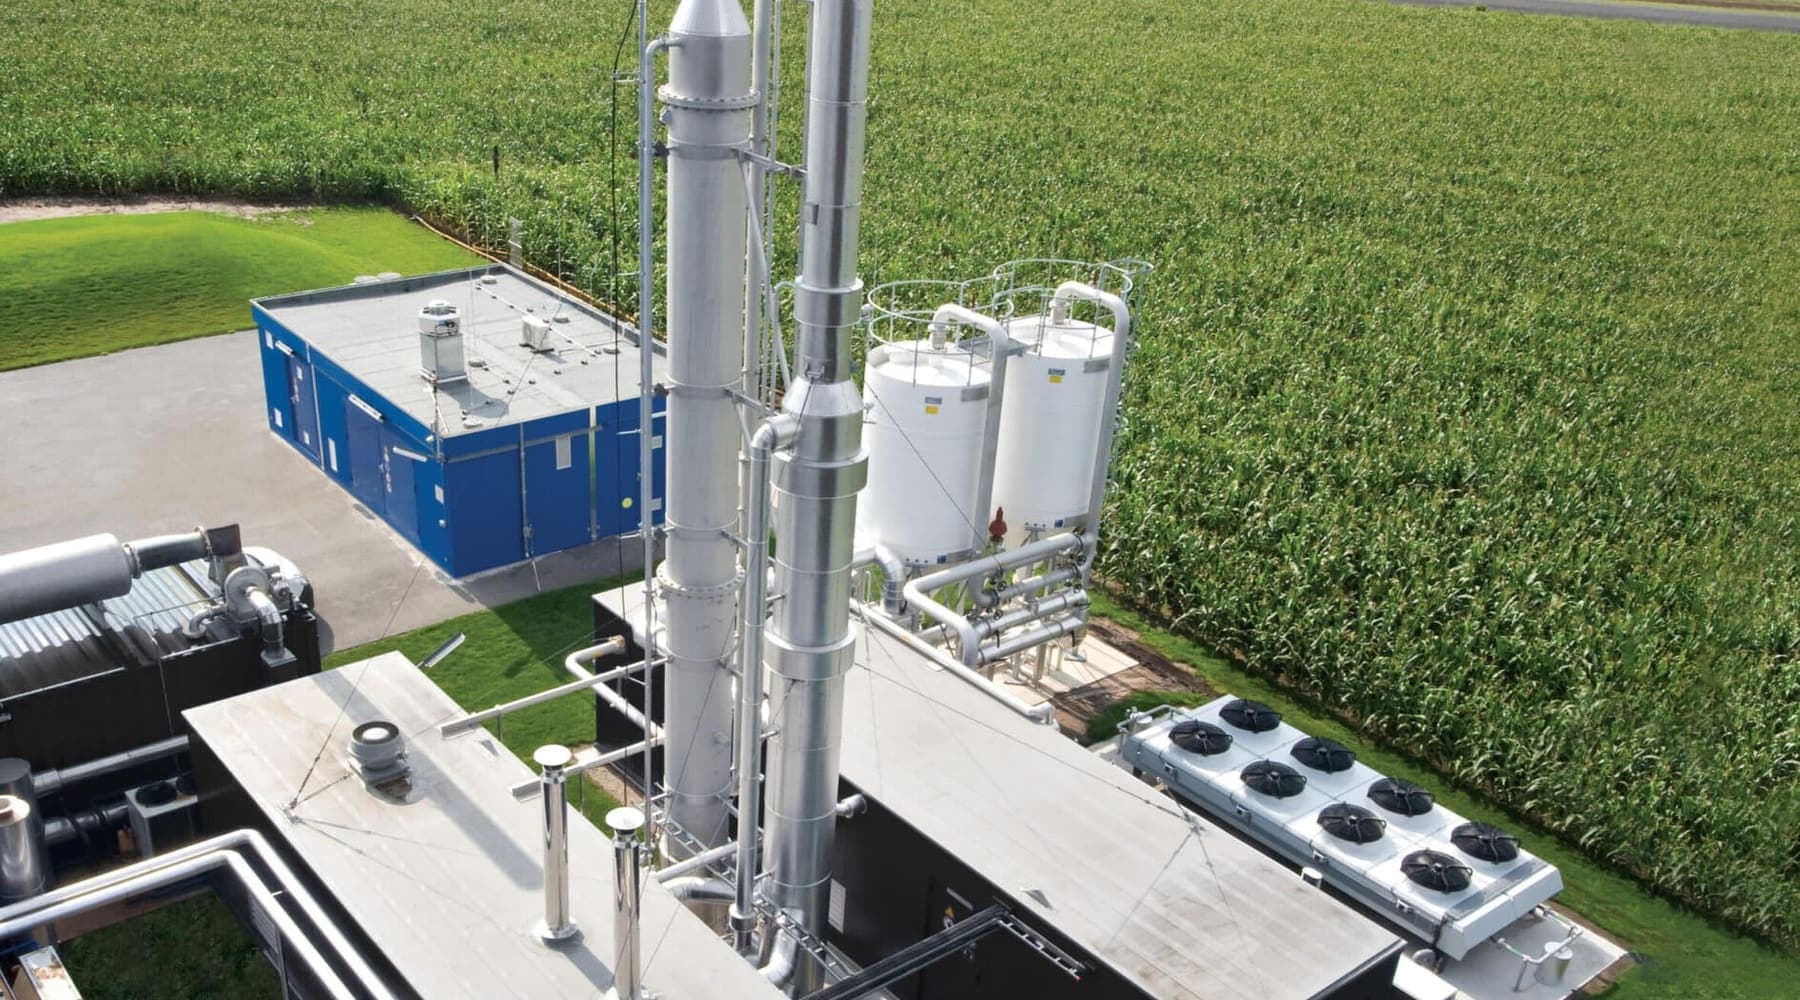
Aerial view of a compact carbon capture plant, its two columns and amine tanks standing beside a field

Carbon Capture Facilities

Capture is the unit we calibrated on. Its energy bill decides whether the project works.

A post-combustion capture plant is an absorber, a stripper and a reboiler running the solvent chemistry this platform was built and proven on. It is also an industry where the gap between a viable project and a stranded asset is a few tenths of a gigajoule per tonne — which makes it the clearest case anywhere for a model that prices energy while it is being spent.

77Operating CCS facilities worldwide, capturing 64 Mt a year
513 MtCapture capacity operating or in development, up 23% in a year
5×Expected growth in operating capture capacity between 2025 and 2030
~50%Share of the annualised cost of amine scrubbing that is energy

SOURCEDGlobal CCS Institute, Global Status of CCS 2025 · peer-reviewed process assessments of amine-based capture. Every figure on this page is linked at the foot of it.

Part one — the capability

What a platform built this way does across a capture plant.

The engine compares what the plant is doing against what physics says a healthy unit should be doing, ranks the gaps, names the cause behind each one and prices the consequence. On a capture plant that price is denominated in the only unit the industry argues about: cost per tonne.

Calibrated here

Absorber, stripper and the solvent loop

What goes wrongFoaming, absorber flooding, lean/rich exchanger fouling, reboiler scaling and corrosion, filter plugging, pump cavitation.

What comes back22 named faults, each with the root cause behind it and the evidence that fired. Capture rate held, and the reboiler duty behind every tonne accounted for rather than assumed.

Calibrated here

Solvent degradation, reclaiming and heat-stable salts

What goes wrongOxidative and thermal degradation, heat-stable salt build-up, the slow climb in circulation needed to hold the same capture rate, reclaimer waste.

What comes backDegradation separated from operating change, so make-up cost and reclaiming timing are decided on a curve rather than on a laboratory sample that arrived three weeks late.

Next — calibration work

Flue gas conditioning and the water wash

What goes wrongParticulates, SOₓ and NOₓ reaching the solvent, direct contact cooler performance, amine emissions and aerosol carryover from the wash section.

What comes backWhat the flue gas is actually doing to the solvent inventory, priced against make-up, and an emissions figure with a derivation rather than a design assumption.

Next — calibration work

CO₂ compression, dehydration and export

What goes wrongCompressor efficiency decay, intercooler fouling, dehydration breakthrough, and specification drift at the pipeline or storage boundary.

What comes backCompression power against modelled power, so the parasitic load on the host plant is a measured number and not a line carried over from the FEED.

Wider chain

Steam integration with the host plant

What goes wrongExtraction steam competing with power or heat the host could have sold, letdown losses, and a plant that quietly runs the capture unit at the wrong operating point to protect the host.

What comes backThe true cost of the steam the capture plant is taking, hour by hour, against what that steam was worth to the host — one number both sides can plan on.

Wider chain

Capture rate assurance and MRV reporting

What goes wrongCapture rate reconstructed after the fact, measurement gaps closed by estimate, and a reported tonnage that has to survive an auditor and a credit scheme.

What comes backModelled against measured balances, so a missing tonne has a location and a reported figure has a derivation someone can follow line by line.

One answer, four audiences

The same diagnosis has to serve the console and the board.

A finding only a specialist can read gets ignored; a finding only a manager can read gets distrusted. Because every call is denominated in both engineering units and money, one output serves everybody without being rewritten.

The board operator

One ranked list at the start of a shift, in plant units, with the evidence attached. Not four hundred alarms and a colour.

The process engineer

The residual against expected-healthy, the indicators that fired, the ones that corroborate, and the ones that would have ruled the fault out. Something concrete to disagree with.

Reliability and maintenance

Which item is degrading, how quickly, and what each week of delay costs. Cleaning and outage scope argued from a number instead of from a habit.

Planning, economics and HSE

Energy and losses per unit, priced daily. The margin review and the emissions report draw on one model, so they stop disagreeing with each other.

Part two — the market

A young industry that has to prove its cost per tonne before it can raise the next round.

Capture is not short of engineering or of capital appetite. It is short of operating evidence — and the evidence that decides the sector is energy per tonne, sustained, on a plant that is running. On the left is how that evidence is handled today. On the right is what it is worth.

How the data is handled today

  • Most operating plants are first-of-a-kind. There is no fleet to benchmark against and often no second unit on site.
  • Capture rate is reported monthly. The reboiler duty that actually sets cost per tonne is reviewed in a spreadsheet after the quarter closes.
  • Solvent degradation is tracked by periodic laboratory samples — which is to say it is discovered weeks after it started.
  • The energy penalty is quoted from the design case, long after the plant stopped running at the design case.
  • Vendor performance guarantees are argued from data that neither side models the same way.
  • Machine-learning pilots need failure examples. A plant two years old has almost none, and the ones it has are the expensive kind.

What that leaves on the table

  • ~50% of costEnergy can be half the annualised cost of amine scrubbing. It is also the half an operator can move this week.
  • 2–3× minimumActual solvent regeneration heat against the theoretical minimum of roughly 1.9 MJ per kg. The gap is operating point, degradation and fouling — all three diagnosable.
  • $54–59 / tCapture cost reached with process modifications in published assessments, against €90–156 per tonne for less optimised configurations.
  • 64 → 5× by 2030Operating capture capacity is expected to be five times higher in 2030 than in 2025. Every one of those plants commissions with no failure history.
  • First-of-a-kindThe condition of most capture assets today — and precisely where a physics reference model has an advantage a data-driven one cannot have.

To put one number on itThree tenths of a gigajoule per tonne of avoidable reboiler duty, on a plant capturing one million tonnes a year, is 300,000 GJ of steam a year — roughly $2.5–3.5 million at typical industrial steam cost. That is arithmetic with the steam price stated, not a forecast. The usual causes are a fouled lean/rich exchanger or a degraded solvent, and both are already among the twenty-two faults this platform names.

Why this and not another dashboard

Four things a physics model does that a pattern-matcher cannot.

WORKS FROM DAY ONE

A statistical model has to be shown the fault before it can find it. A physics reference model needs equipment datasheets. On a unit that has never failed inside its recorded history — which is most units, and every new-build — only one of those two is any use.

EXPLAINS ITSELF

Every diagnosis carries the indicators that fired, the ones that corroborate it, and the ones that would have ruled it out. An engineer can argue with it. That is the only reason anyone in a control room ever acts on it.

ENDS IN MONEY

Six consequences are priced directly, so a finding arrives as a cost per hour rather than a severity colour. The same output serves the operator, the planner and the board without being rewritten for each.

PORTS BY CALIBRATION

The cost of the next unit is datasheets, a tag list and a fitting pass — not a new product. That is the whole scaling argument: the platform grows by calibration, and calibration is the cheapest thing in this business to change.

The path from the calibrated unit

One unit is proven. The rest is calibration.

Each stage below reuses the same engine and the same knowledge-base structure. What changes is the unit it is fitted to — and that is deliberately the cheapest thing in this business to change.

  1. 1

    Today — the capture island, calibrated

    Absorber, water wash, lean/rich exchanger, stripper, reboiler and the full solvent circuit, fitted against an operating amine train with thirteen days of one-minute history: 26 equipment items, 161 tags, 22 faults, 19 root causes, 54 indicators, 6 costed consequences.

  2. 2

    The balance of the capture plant

    Flue gas conditioning, the direct contact cooler, the water wash and the CO₂ compression and dehydration train. Same physics, documented equipment, and a calibration pass against your own history.

  3. 3

    Steam integration with the host

    Where the capture plant stops being a standalone unit and starts being an argument with the host about extraction steam. Modelling both sides puts a number on that argument instead of a preference.

  4. 4

    Cost per tonne as the objective function

    The two hard parts of an optimiser already exist here: a validated plant model and an objective denominated in money. Scoring candidate operating points automatically — rather than one at a time — turns diagnosis into a decision.

Being straight about it

What this page is not claiming.

  • The amine capture island is calibrated. Flue gas conditioning, compression, the host steam interface and MRV are the same method applied to equipment we have documented but not yet fitted, and this page marks the difference rather than blurring it.
  • The market figures above come from the Global CCS Institute and from peer-reviewed process assessments. They size an industry. They are not results we have measured on your plant.
  • Each new unit needs equipment datasheets, a tag list and enough history to fit against. That is engineering work measured in weeks — not a configuration screen, and not a model you point at a historian and leave running.

Cost per tonne is a calculation. See it made.

The platform runs on a real amine train with thirteen days of one-minute history behind it — live diagnosis, ranked evidence, root causes and cost per hour. It is the same chemistry and the same fault set your capture plant runs on.