
Now live: a hybrid process digital twin for amine gas sweetening — it names the fault and the root cause, not just the alarm. Request a demo →

QEM & OPS logo
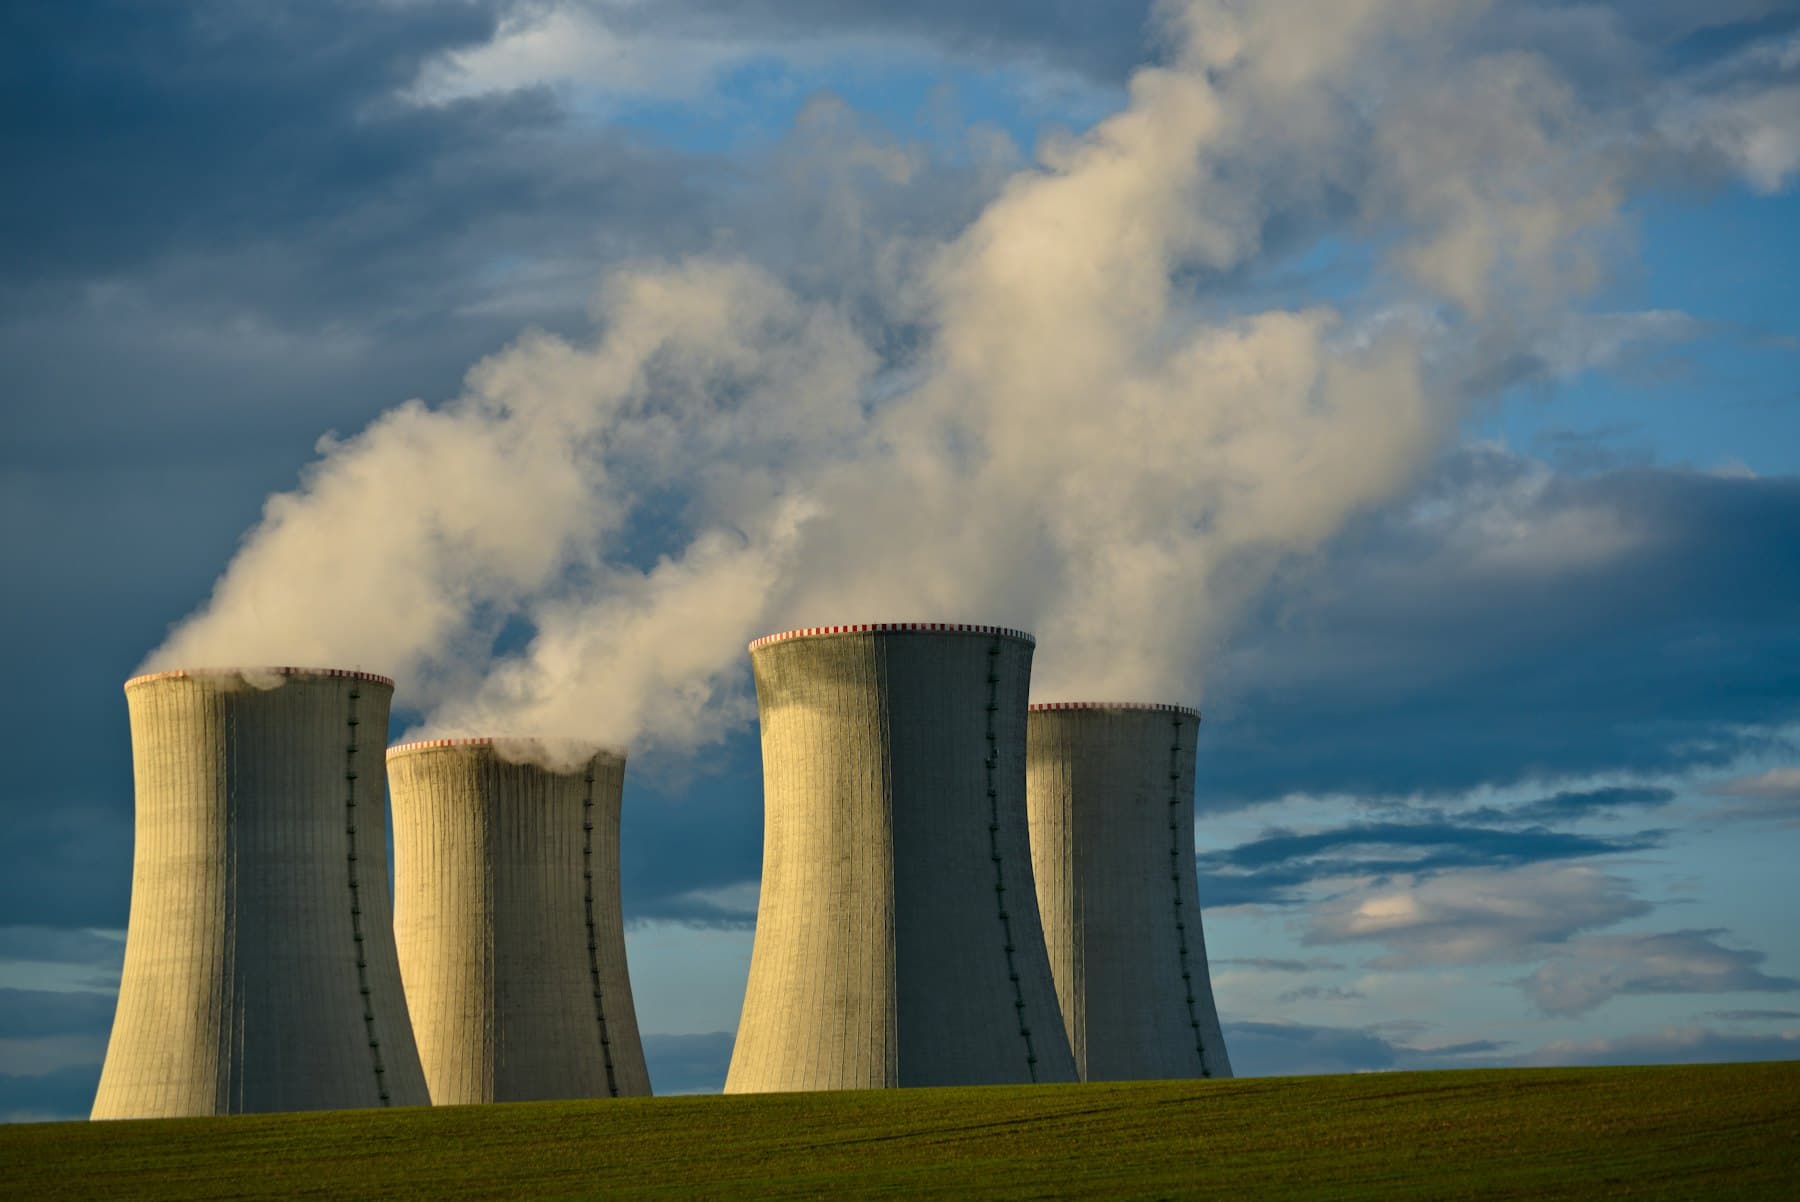
Power station cooling towers under a bright sky

Utilities & District Energy

Bolt capture onto a boiler and you have inherited an amine plant. That part we already know.

District heating, CHP and waste-to-energy sites adding post-combustion capture inherit the exact unit this platform was built and calibrated on — along with the foaming, fouling and solvent losses that come with it. The same method reads the boiler, the turbine and the network too, and in a public asset the numbers it produces are the ones the regulator and the customer both ask for.

> 10%Of global heat demand in buildings is met by district heating networks
650 mDistrict heating consumers expected worldwide by 2030
3,100+Thermal waste treatment plants operating globally, above 640 Mt a year
21.8 GWRecord global municipal waste-to-energy generating capacity

SOURCEDIEA district heating analysis · ecoprog waste-to-energy survey · Global CCS Institute. Every figure on this page is linked at the foot of it.

Part one — the capability

What a platform built this way does across a utility site.

The engine compares what the plant is doing against what physics says a healthy unit should be doing, ranks the gaps, names the cause behind each one and prices the consequence. On a public asset that price is not only money — it is heat that was going to be sold, and an efficiency figure somebody will be asked to defend.

Calibrated here

The capture island, existing or planned

What goes wrongFoaming, absorber flooding, lean/rich exchanger fouling, reboiler scaling and corrosion, filter plugging, solvent degradation and losses.

What comes back22 named faults, each with the root cause behind it and the evidence that fired. This is the unit the platform was built on — a capture retrofit is the one part of your site that needs no new science.

Next — calibration work

Boiler and combustion

What goes wrongExcess air, fouling and slagging on the heat transfer surfaces, air leakage, and a fuel — especially waste — whose calorific value moves every hour.

What comes backMeasured duty against modelled duty at the fuel actually being burned, so an efficiency drop is separated from a bad fuel batch instead of being blamed on one.

Next — calibration work

Steam turbine and heat rate

What goes wrongHeat rate creep, blade deposits, condenser fouling and vacuum loss, extraction balance between power and heat that drifts away from optimal.

What comes backThe real cost of the last megawatt against the last megajoule of heat, hour by hour — the trade that a CHP set makes constantly and prices annually.

Wider site

The heat network

What goes wrongReturn temperature drifting up, distribution losses assumed from a commissioning figure, pumping power spent to overcome a fault nobody has located.

What comes backModelled against measured losses along the network, so a leak or a mis-set substation has a location rather than an allowance.

Wider site

Flue gas treatment and emissions

What goes wrongReagent overdosing, bag filter and scrubber performance decay, and continuous emissions data that has to survive a regulator rather than an internal review.

What comes backReagent consumption against what the measured flue gas actually required, and an emissions figure with a derivation somebody can follow line by line.

Wider site

Demand, dispatch and fuel

What goes wrongPlant dispatched on yesterday’s pattern, storage used by habit, and fuel or waste feed quality treated as a constant when it is the largest variable on site.

What comes backWhat each unit costs to run right now against what it delivers, so dispatch is a calculation rather than a convention.

One answer, four audiences

The same diagnosis has to serve the console and the board.

A finding only a specialist can read gets ignored; a finding only a manager can read gets distrusted. Because every call is denominated in both engineering units and money, one output serves everybody without being rewritten.

The board operator

One ranked list at the start of a shift, in plant units, with the evidence attached. Not four hundred alarms and a colour.

The process engineer

The residual against expected-healthy, the indicators that fired, the ones that corroborate, and the ones that would have ruled the fault out. Something concrete to disagree with.

Reliability and maintenance

Which item is degrading, how quickly, and what each week of delay costs. Cleaning and outage scope argued from a number instead of from a habit.

Planning, economics and HSE

Energy and losses per unit, priced daily. The margin review and the emissions report draw on one model, so they stop disagreeing with each other.

Part two — the market

Public assets, public numbers, and very little between the meter and the annual report.

A utility’s performance is scrutinised by a regulator, a municipality and its own customers. The measurements already exist. What is missing is the chain from a measurement to a number somebody can defend in public. On the left is how that is handled today; on the right is what it is worth to do properly.

How the data is handled today

  • Boiler and network efficiency is reported annually from meter totals, long after anything could have been done about it.
  • Return temperature — the single largest lever on network efficiency — is watched as a trend, not modelled against what it should be.
  • Distribution heat loss is carried as a percentage that dates from commissioning and has never been re-derived.
  • Capture retrofits are evaluated on a vendor design case, because there is no operating evidence on site to argue from.
  • Maintenance is calendar-based, and a boiler outage in February is not a maintenance issue — it is a public one.
  • Efficiency and emissions reporting is assembled by hand from several systems that disagree with each other.

What that leaves on the table

  • 650 m consumersDistrict heating consumers expected worldwide by 2030. Every one is a customer whose bill is set by the efficiency of a network that is measured but not modelled.
  • 3,100+ plantsThermal waste treatment plants operating globally, above 640 Mt a year of capacity — most of them public or regulated assets where an unexplained efficiency drop becomes a council question.
  • ~50% of costEnergy as a share of the annualised cost of the amine capture unit a retrofit brings with it. It is the largest single line in the business case.
  • 5× by 2030Expected growth in operating carbon capture capacity. Waste-to-energy and district heating are among the largest categories in that pipeline (Global CCS Institute).
  • First-of-a-kindWhat a capture retrofit on a boiler is, on almost every site. There is no failure history to learn from — only physics, which is what this platform is made of.

To put one number on itA capture retrofit on a waste-to-energy line capturing 400,000 tonnes a year, running three tenths of a gigajoule per tonne above where it should be, wastes about 120,000 GJ of steam a year — heat that was going to be sold. At typical heat network value that is on the order of $1 million a year, from one avoidable cause. The steam price is an assumption, stated so you can substitute your own; the physics behind the 0.3 GJ is not.

Why this and not another dashboard

Four things a physics model does that a pattern-matcher cannot.

WORKS FROM DAY ONE

A statistical model has to be shown the fault before it can find it. A physics reference model needs equipment datasheets. On a unit that has never failed inside its recorded history — which is most units, and every new-build — only one of those two is any use.

EXPLAINS ITSELF

Every diagnosis carries the indicators that fired, the ones that corroborate it, and the ones that would have ruled it out. An engineer can argue with it. That is the only reason anyone in a control room ever acts on it.

ENDS IN MONEY

Six consequences are priced directly, so a finding arrives as a cost per hour rather than a severity colour. The same output serves the operator, the planner and the board without being rewritten for each.

PORTS BY CALIBRATION

The cost of the next unit is datasheets, a tag list and a fitting pass — not a new product. That is the whole scaling argument: the platform grows by calibration, and calibration is the cheapest thing in this business to change.

The path from the calibrated unit

One unit is proven. The rest is calibration.

Each stage below reuses the same engine and the same knowledge-base structure. What changes is the unit it is fitted to — and that is deliberately the cheapest thing in this business to change.

  1. 1

    Today — the amine capture unit, calibrated

    Absorber, water wash, lean/rich exchanger, stripper, reboiler and the full solvent circuit, fitted against an operating amine train with thirteen days of one-minute history: 26 equipment items, 161 tags, 22 faults, 19 root causes, 54 indicators, 6 costed consequences.

  2. 2

    The capture island on your host plant

    Your flue gas, your solvent, your steam supply. This is a calibration against your own history rather than a new model, which is why a capture retrofit is the cheapest place on a utility site to start.

  3. 3

    Boiler, combustion and steam integration

    Where the capture plant stops being separable from the host. Modelling both sides puts a number on the steam the capture unit is taking, against what that steam was worth as heat or power.

  4. 4

    The network — return temperature, losses and dispatch

    The part of a district energy business that is measured everywhere and modelled nowhere. Closing that loop turns an annual efficiency report into an operating decision.

Being straight about it

What this page is not claiming.

  • The capture island is the calibrated unit. The boiler, the turbine and the heat network sit outside what we have fitted today — they are the same method applied to equipment we can describe but have not yet calibrated, and we would rather tell you that than quietly widen the claim.
  • The market figures above come from the IEA, from published waste-to-energy surveys and from the Global CCS Institute. They size an industry. They are not results we have measured on your plant.
  • Each new unit needs equipment datasheets, a tag list and enough history to fit against. That is engineering work measured in weeks — not a configuration screen, and not a model you point at a historian and leave running.

The capture plant is the part we already know.

The platform runs on a real amine train with thirteen days of one-minute history behind it — live diagnosis, ranked evidence, root causes and cost per hour. It is the same unit a capture retrofit puts on your site.