Now live: a hybrid process digital twin for amine gas sweetening — it names the fault and the root cause, not just the alarm. Request a demo →

QEM & OPS logo
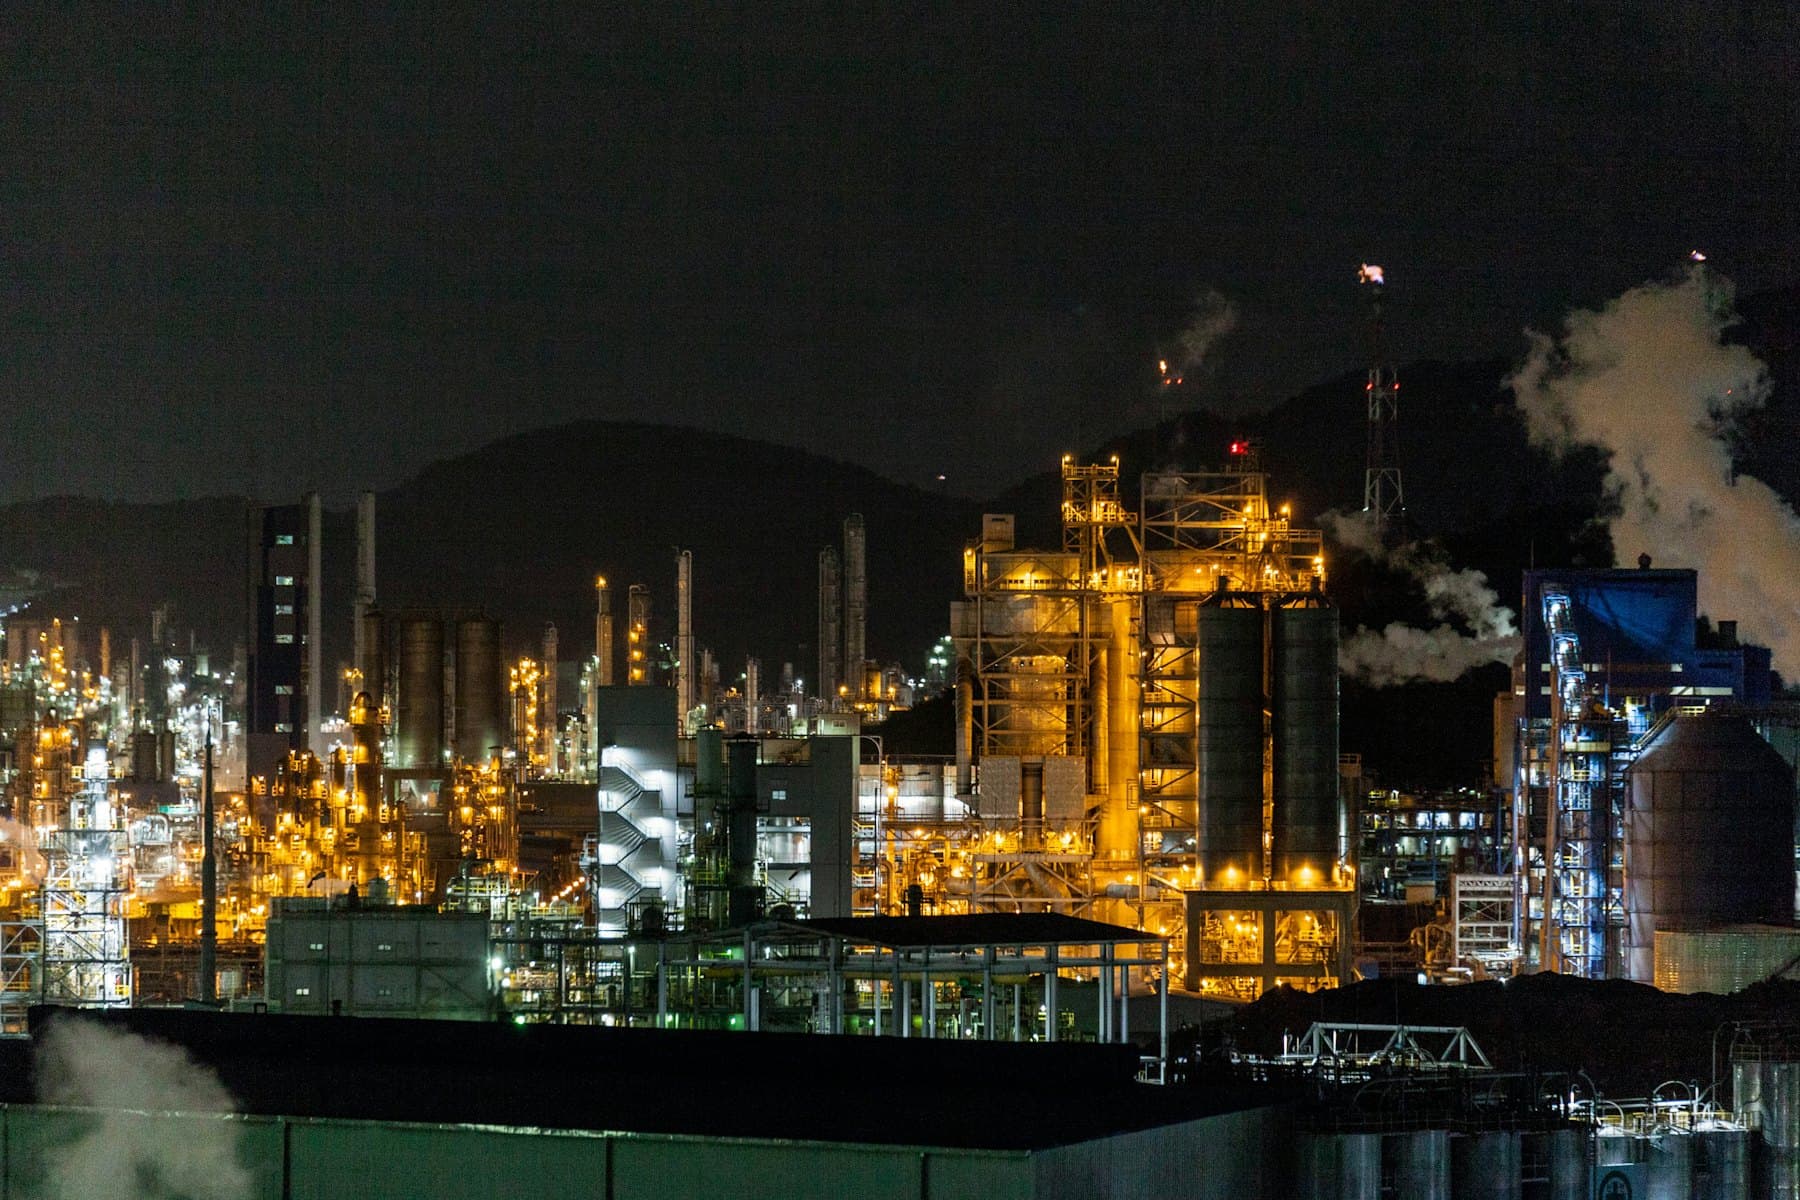
Refinery complex lit at night

Refineries

The unit we have proven sits inside almost every refinery. So does the problem it solves.

Refinery amine treating is where our model is calibrated today, and nearly every refinery runs one. But the method underneath it is not amine chemistry. It is a physics reference model, residuals against expected-healthy, graded evidence and consequences priced in money — and a refinery has thirty units that need exactly that.

650+Refineries operating, across more than 120 countries
103.7Million barrels a day of crude distillation capacity worldwide
~4%Of global CO₂ emissions come from oil refining
<1%Of the data an instrumented site collects reaches the people who decide

SOURCEDOPEC Annual Statistical Bulletin (data to end-2025) · Nature Climate Change, 2020 · McKinsey. Every figure on this page is linked at the foot of it.

Part one — the capability

What a platform built this way does inside a refinery.

The engine does not know it is looking at amine. It compares what the plant is doing against what physics says a healthy unit should be doing, ranks the gaps, names the cause behind each one and prices the consequence. Every block below is that same loop pointed at a different unit — which is why extending it is calibration work rather than invention.

Modelled today

Amine treating and the sulphur block

What goes wrongFoaming, absorber flooding, lean/rich exchanger fouling, reboiler scaling and corrosion, filter plugging, pump cavitation.

What comes back22 named faults, each with the root cause behind it, the evidence that fired, and the cost per hour of leaving it alone. H₂S in fuel gas held to spec, and a steady feed to the sulphur plant.

Next — calibration work

Crude preheat train and the CDU

What goes wrongFouling closes the preheat train a fraction of a degree at a time. The furnace buys the heat back until it runs out of duty, and then throughput comes off.

What comes backA fouling rate per exchanger measured against clean-condition physics, the fuel it is costing today, and the date on which cleaning pays for the outage.

Next — calibration work

Fired heaters and the steam system

What goes wrongExcess air, burner imbalance, tube skin drift, failed traps and letdown that quietly waste the fuel the heater has just bought.

What comes backMeasured duty against modelled duty, with the shortfall split by cause and converted into fuel, money and CO₂ — the three units the board already reports in.

Wider site

Hydrotreating and hydrocracking

What goes wrongCatalyst deactivation, weighted average bed temperature creep, hydrogen purity loss, reactor pressure drop, quench imbalance.

What comes backDeactivation separated from feed change and from operating change, so the end-of-run date becomes a calculation the planner and the technologist can both read.

Wider site

FCC, the gas plant and rotating equipment

What goes wrongCatalyst circulation upsets, regenerator afterburn, wet gas compressor limits, fractionator flooding, pump and compressor degradation.

What comes backWhich constraint is actually binding right now, how far the unit is from it, and what that distance is worth per hour of run time.

Wider site

Flare, losses and emissions reporting

What goes wrongLosses that are estimated rather than measured, and an emissions figure assembled by hand once a quarter out of other people’s spreadsheets.

What comes backModelled against measured balances across the site, so a loss has a location and an emissions number has a derivation an auditor can follow.

One answer, four audiences

The same diagnosis has to serve the console and the board.

A finding only a specialist can read gets ignored; a finding only a manager can read gets distrusted. Because every call is denominated in both engineering units and money, one output serves everybody without being rewritten.

The board operator

One ranked list at the start of a shift, in plant units, with the evidence attached. Not four hundred alarms and a colour.

The process engineer

The residual against expected-healthy, the indicators that fired, the ones that corroborate, and the ones that would have ruled the fault out. Something concrete to disagree with.

Reliability and maintenance

Which item is degrading, how quickly, and what each week of delay costs. Cleaning and outage scope argued from a number instead of from a habit.

Planning, economics and HSE

Energy and losses per unit, priced daily. The margin review and the emissions report draw on one model, so they stop disagreeing with each other.

Part two — the market

A large industry, instrumented to the teeth, deciding on a fraction of what it measures.

Refining is not short of data, engineers or capital. It is short of a way to turn one into the other. On the left is how the industry handles its measurements today. On the right is what independent studies say that habit costs.

How the data is handled today

  • A single site historises tens of thousands of tags at one-second resolution and keeps them for years.
  • Less than 1% of what is collected reaches the people who make decisions — McKinsey’s finding on instrumented oil and gas operations.
  • Alarm rates on unrationalised consoles run an order of magnitude above the EEMUA 191 guideline of roughly six an hour. That is volume, not diagnosis.
  • Unit performance is reviewed monthly, in spreadsheets built by hand, weeks after the money was spent.
  • Maintenance is largely calendar-based or reactive. Fouling and degradation are found at the turnaround rather than before it.
  • Machine-learning pilots return a score nobody will sign, because the model cannot say why it said so.

What that leaves on the table

  • $0.10–0.20 / bblFrom analytics-driven yield optimisation alone (McKinsey).
  • $0.30–0.50 / bblFrom end-to-end optimisation of yield, energy and throughput (McKinsey).
  • $30–85 m a yearWhat a well-run value chain optimisation is worth to a mid-size refiner, at $0.50–1.00 a barrel (McKinsey).
  • > $2 bn a yearThe fouling penalty in US refineries alone, of which $1.0–1.2 bn sits in the crude preheat train (US DOE Industrial Technologies Program; Heat Transfer Engineering, 2023).
  • 606 MJ / bblWorld average refining energy use, at 40.7 kg CO₂e a barrel. The largest controllable cost in the plant is also its largest emission (Nature Climate Change, 2020).

To put one number on itAt the middle of McKinsey’s end-to-end range, $0.30 a barrel on a single 200,000 bpd refinery is about $22 million a year, and there are more than 650 refineries. That is arithmetic on someone else’s published range rather than a forecast of ours — but it is the order of magnitude the conversation starts at.

Why this and not another dashboard

Four things a physics model does that a pattern-matcher cannot.

WORKS FROM DAY ONE

A statistical model has to be shown the fault before it can find it. A physics reference model needs equipment datasheets. On a unit that has never failed inside its recorded history — which is most units, and every new-build — only one of those two is any use.

EXPLAINS ITSELF

Every diagnosis carries the indicators that fired, the ones that corroborate it, and the ones that would have ruled it out. An engineer can argue with it. That is the only reason anyone in a control room ever acts on it.

ENDS IN MONEY

Six consequences are priced directly, so a finding arrives as a cost per hour rather than a severity colour. The same output serves the operator, the planner and the board without being rewritten for each.

PORTS BY CALIBRATION

The cost of the next unit is datasheets, a tag list and a fitting pass — not a new product. That is the whole scaling argument: the platform grows by calibration, and calibration is the cheapest thing in this business to change.

The path from the calibrated unit

One unit is proven. The rest is calibration.

Each stage below reuses the same engine and the same knowledge-base structure. What changes is the unit it is fitted to — and that is deliberately the cheapest thing in this business to change.

  1. 1

    Today — the amine unit, already inside the refinery fence

    Calibrated against an operating gas sweetening train with thirteen days of one-minute history: 26 equipment items, 161 tags, 22 faults, 19 root causes, 54 indicators, 6 costed consequences. Almost every refinery treats fuel gas and LPG on this same chemistry, so a first install needs no new science — only your tags.

  2. 2

    Next door — the sulphur block

    Sulphur recovery, tail gas treating and sour water stripping sit in the same sour service and share most of the thermal and solvent behaviour. Extending here is calibration and knowledge-base work against units we can already describe.

  3. 3

    The energy and fouling network

    The crude preheat train, the fired heaters and the steam system. This is where the published prize is largest and where the physics is best understood — heat balances and clean-condition duty are exactly what a reference model is good at.

  4. 4

    The whole site, on one costed picture

    Reactors, FCC, rotating equipment and utilities, reporting into a single objective function denominated in money. At that point the platform is not a monitoring tool. It is how the site decides what to do next.

Being straight about it

What this page is not claiming.

  • Nothing on this page outside the amine unit is calibrated today. The rest is the same method applied to units we have documented but not yet fitted, and we would rather say so here than let you find it later.
  • The market figures above are third-party estimates for the refining industry. They size an opportunity. They are not results we have measured, and we do not present them as ours.
  • Each new unit needs equipment datasheets, a tag list and enough history to fit against. That is engineering work measured in weeks — not a configuration screen, and not a model you point at a historian and leave running.

See the method working before you back the next unit.

The platform runs on a real amine train with thirteen days of one-minute history behind it — live diagnosis, ranked evidence, root causes and cost per hour. Ten minutes in it says more about whether this extends to a refinery than any slide can.