Now live: a hybrid process digital twin for amine gas sweetening — it names the fault and the root cause, not just the alarm. Request a demo →

QEM & OPS logo
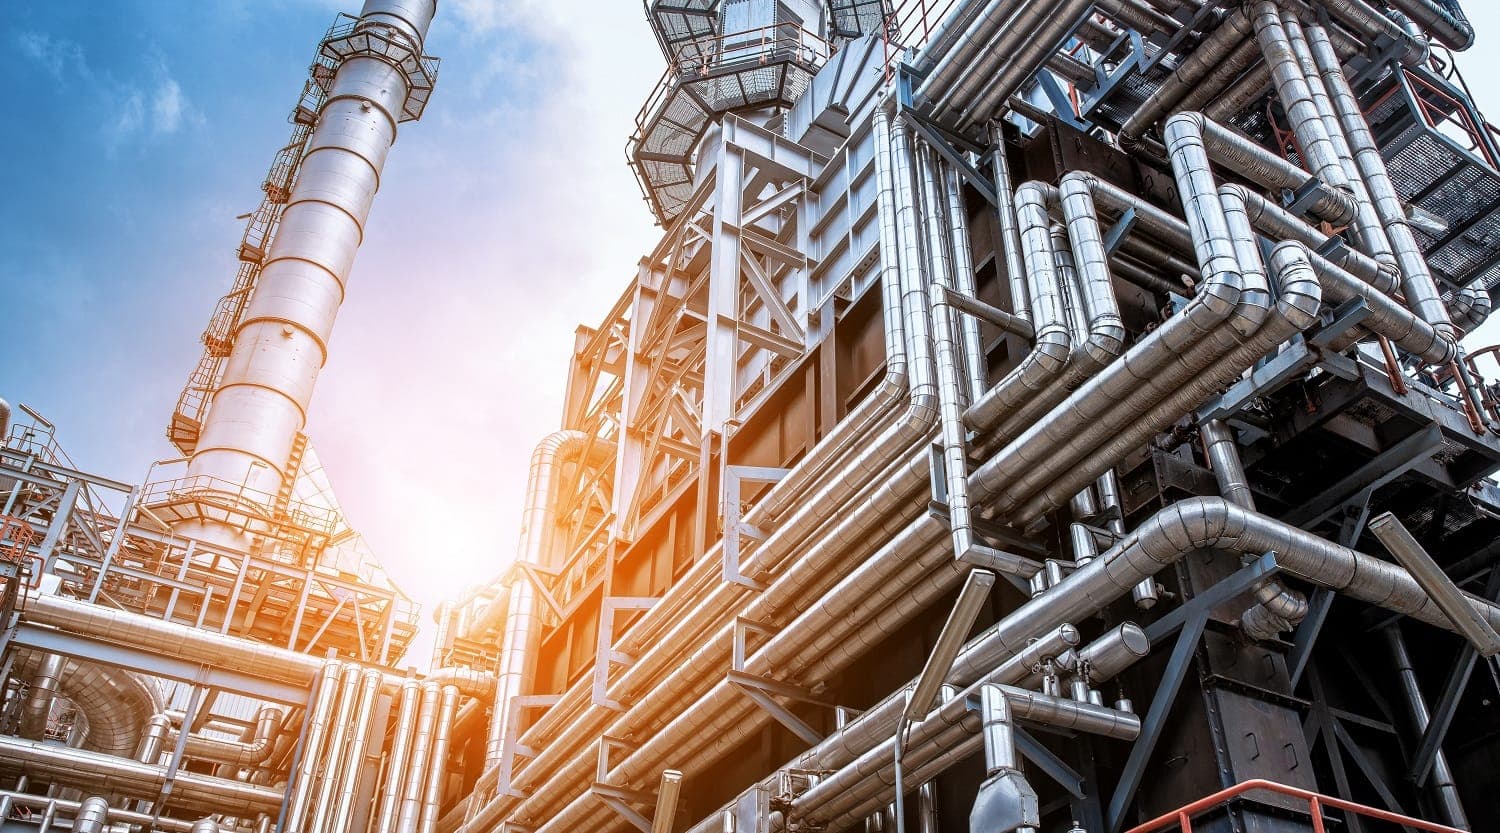
Process piping and columns seen from below against a bright sky

Chemical Plants

The removal loop is the door. The energy bill is the reason to walk through it.

Ammonia, methanol, hydrogen and ethylene oxide plants all run a CO₂ removal loop on amine or hot potassium carbonate — the structure this platform was built on. But chemicals is the largest industrial energy consumer on earth, and almost none of that energy is in the removal loop. It is in the reformers, the crackers, the columns and the compressors around it.

LargestIndustrial energy consumer worldwide — the chemical sector
11% / 8%Of global oil and of global natural gas demand goes to chemicals
20–40 GJEnergy per tonne of ethylene from a naphtha steam cracker
3rdLargest industrial source of direct CO₂, behind steel and cement

SOURCEDIEA chemicals sector analysis · published steam cracking energy assessments. Every figure on this page is linked at the foot of it.

Part one — the capability

What a platform built this way does across a chemical site.

The engine does not know which solvent is in the loop. It compares what the plant is doing against what physics says a healthy unit should be doing, ranks the gaps, names the cause behind each one and prices the consequence. That works on a removal loop, and it works on the fired equipment where the site’s energy actually goes.

Same loop — one calibration pass

Acid gas and CO₂ removal loops

What goes wrongFoaming, absorber flooding, lean/rich exchanger fouling, reboiler scaling and corrosion, filter plugging, solvent degradation.

What comes backThe closest unit on this page to the one we have already calibrated: absorber, flash, lean/rich exchange, regenerator and reboiler. The solvent changes — aMDEA, hot potassium carbonate, a physical solvent — the structure and the failure modes do not.

Next — calibration work

Steam reforming and hydrogen production

What goes wrongCatalyst deactivation and carbon lay-down, tube skin temperature drift, approach to equilibrium falling away, shift conversion loss, PSA recovery decay.

What comes backMeasured conversion against modelled conversion, with the shortfall attributed to catalyst, to firing or to feed — and the fuel each of those is costing per hour.

Wider site

Steam crackers and fired heaters

What goes wrongCoil fouling and coking, run length shortening, excess air and burner imbalance, selectivity drifting away from the target cut.

What comes backDecoking decided on a modelled cost curve rather than a calendar, and firing efficiency reported in fuel, money and CO₂ rather than as a percentage nobody can act on.

Wider site

Distillation trains and separation

What goes wrongFlooding and weeping, tray or packing damage, reflux and reboiler imbalance, product specification giveaway that nobody prices.

What comes backSeparation efficiency against design, and the reboiler duty being spent to make a product purer than the specification requires — usually the quietest large loss on a chemical site.

Wider site

Compressors, refrigeration and rotating equipment

What goes wrongPolytropic efficiency decay, fouled intercoolers, surge margin, seal and lube systems, refrigeration approach loss.

What comes backWhich constraint is actually binding right now, how far the unit is from it, and what that distance is worth per hour of run time.

Wider site

Steam, power and site heat integration

What goes wrongLetdown that should have been a turbine, failed traps, imported power bought while steam is vented, and a site balance nobody has closed since commissioning.

What comes backA closed site energy balance, modelled against measured, so every unit’s share of the energy bill is a number rather than an allocation.

One answer, four audiences

The same diagnosis has to serve the console and the board.

A finding only a specialist can read gets ignored; a finding only a manager can read gets distrusted. Because every call is denominated in both engineering units and money, one output serves everybody without being rewritten.

The board operator

One ranked list at the start of a shift, in plant units, with the evidence attached. Not four hundred alarms and a colour.

The process engineer

The residual against expected-healthy, the indicators that fired, the ones that corroborate, and the ones that would have ruled the fault out. Something concrete to disagree with.

Reliability and maintenance

Which item is degrading, how quickly, and what each week of delay costs. Cleaning and outage scope argued from a number instead of from a habit.

Planning, economics and HSE

Energy and losses per unit, priced daily. The margin review and the emissions report draw on one model, so they stop disagreeing with each other.

Part two — the market

The largest industrial energy consumer on earth, managed on monthly averages.

Chemicals buys more energy than any other industrial sector, which means a single percentage point is a large absolute number. On the left is how that energy is currently tracked. On the right is what independent studies say it is worth to track it properly.

How the data is handled today

  • Energy is reported per site and per month, then allocated to units by a rule agreed years ago rather than measured.
  • Cracker decoking and catalyst changes are scheduled on a calendar or on a vendor curve, not on the plant’s own degradation.
  • Specification giveaway — running a product purer than it has to be — is rarely priced at all, because nobody owns the number.
  • Alarm rates on unrationalised consoles run an order of magnitude above the EEMUA 191 guideline of roughly six an hour. That is volume, not diagnosis.
  • The site steam balance exists as a drawing from commissioning and a spreadsheet that has been patched ever since.
  • Machine-learning pilots return a score nobody will sign, because the model cannot say why it said so.

What that leaves on the table

  • 20–40 GJ / tEnergy per tonne of ethylene from a naphtha cracker. A single point of efficiency on one cracker outweighs the entire monitoring budget of the site.
  • 11% and 8%Of world oil and of world natural gas demand goes to chemicals (IEA). No other industrial sector buys more energy, so every percent is large in absolute terms.
  • 93.5%Production-weighted average steam cracker utilisation. The missing capacity is largely unplanned — and unplanned events are largely preceded by something measurable.
  • 38%The share of the chemical sector’s needed emissions reductions that the IEA attributes to CCUS — which puts an amine unit on far more chemical sites than have one today.
  • 3rd largestIndustrial source of direct CO₂, behind steel and cement. Reporting it defensibly is becoming a licence-to-operate question rather than an ESG nicety.

To put one number on itA naphtha cracker making one million tonnes of ethylene a year at 29 GJ a tonne burns 29 million GJ. One percent of that is 290,000 GJ — on the order of $2–3 million a year at typical industrial fuel cost, from a single point of efficiency on a single unit. The assumption is stated so you can substitute your own fuel price; the arithmetic does not change.

Why this and not another dashboard

Four things a physics model does that a pattern-matcher cannot.

WORKS FROM DAY ONE

A statistical model has to be shown the fault before it can find it. A physics reference model needs equipment datasheets. On a unit that has never failed inside its recorded history — which is most units, and every new-build — only one of those two is any use.

EXPLAINS ITSELF

Every diagnosis carries the indicators that fired, the ones that corroborate it, and the ones that would have ruled it out. An engineer can argue with it. That is the only reason anyone in a control room ever acts on it.

ENDS IN MONEY

Six consequences are priced directly, so a finding arrives as a cost per hour rather than a severity colour. The same output serves the operator, the planner and the board without being rewritten for each.

PORTS BY CALIBRATION

The cost of the next unit is datasheets, a tag list and a fitting pass — not a new product. That is the whole scaling argument: the platform grows by calibration, and calibration is the cheapest thing in this business to change.

The path from the calibrated unit

One unit is proven. The rest is calibration.

Each stage below reuses the same engine and the same knowledge-base structure. What changes is the unit it is fitted to — and that is deliberately the cheapest thing in this business to change.

  1. 1

    Today — the calibrated amine train, and why your removal loop is one step from it

    Fitted against an operating gas sweetening train with thirteen days of one-minute history: 26 equipment items, 161 tags, 22 faults, 19 root causes, 54 indicators, 6 costed consequences. A CO₂ removal loop in an ammonia or hydrogen plant is the same absorber-regenerator structure with a different solvent in it.

  2. 2

    The removal loop on your solvent

    aMDEA, hot potassium carbonate or a physical solvent. What changes is the thermodynamic package and the fitted parameters; what stays is the equipment, the fault library and the way evidence is graded. This is the shortest calibration on the page.

  3. 3

    Reforming, cracking and the fired equipment

    Where the site’s energy actually goes, and where the published prize is largest. Conversion against modelled conversion and duty against modelled duty are exactly the questions a physics reference model exists to answer.

  4. 4

    The site, on one costed picture

    Separations, rotating equipment and the steam and power balance, reporting into a single objective function denominated in money. At that point every unit’s share of the energy bill is measured rather than allocated.

Being straight about it

What this page is not claiming.

  • No chemical plant unit is calibrated today. The platform is fitted to an amine gas sweetening train, and everything on this page is that same method applied to units we can describe but have not yet fitted. The removal loop is genuinely close; the crackers and reformers are further.
  • The market figures above come from the IEA and from published energy assessments of the sector. They size an industry. They are not results we have measured on your plant.
  • Starting here needs equipment datasheets, a tag list, your solvent’s property data and enough history to fit against. That is engineering work measured in weeks — not a configuration screen, and we would rather say so now than after a purchase order.

Start at the loop you already recognise.

The platform runs on a real amine train with thirteen days of one-minute history behind it — live diagnosis, ranked evidence, root causes and cost per hour. It is the same absorber-and-regenerator structure your CO₂ removal unit is built from.

Sources

The industry figures on this page are public and third-party. The amine figures — 22 faults, 19 root causes, 54 indicators, 6 costed consequences, thirteen days of one-minute history — are ours, and are countable in the platform.